How to setup KONG API Gateway instrumentation
Last updated: August 18, 2025
Overview
Kong API Gateway instrumentation with the OpenTelemetry plugin allows for detailed API traffic observation, enabling API visibility.
It integrates Kong’s traffic-handling capabilities with the OpenTelemetry Collector, feeding live API data into the Astra Traffic Collector. This instrumentation is ideal when you need near-real time API inventory.
Architecture
The high-level flow is:
Client sends a request to Kong Gateway.
Kong Gateway processes the request.
OpenTelemetry Plugin collects tracing and metrics data.
Data is sent to the Astra Traffic Collector over OTLP (HTTP/HTTPS).
Astra processes the data for API inventory and vulnerability scanning.
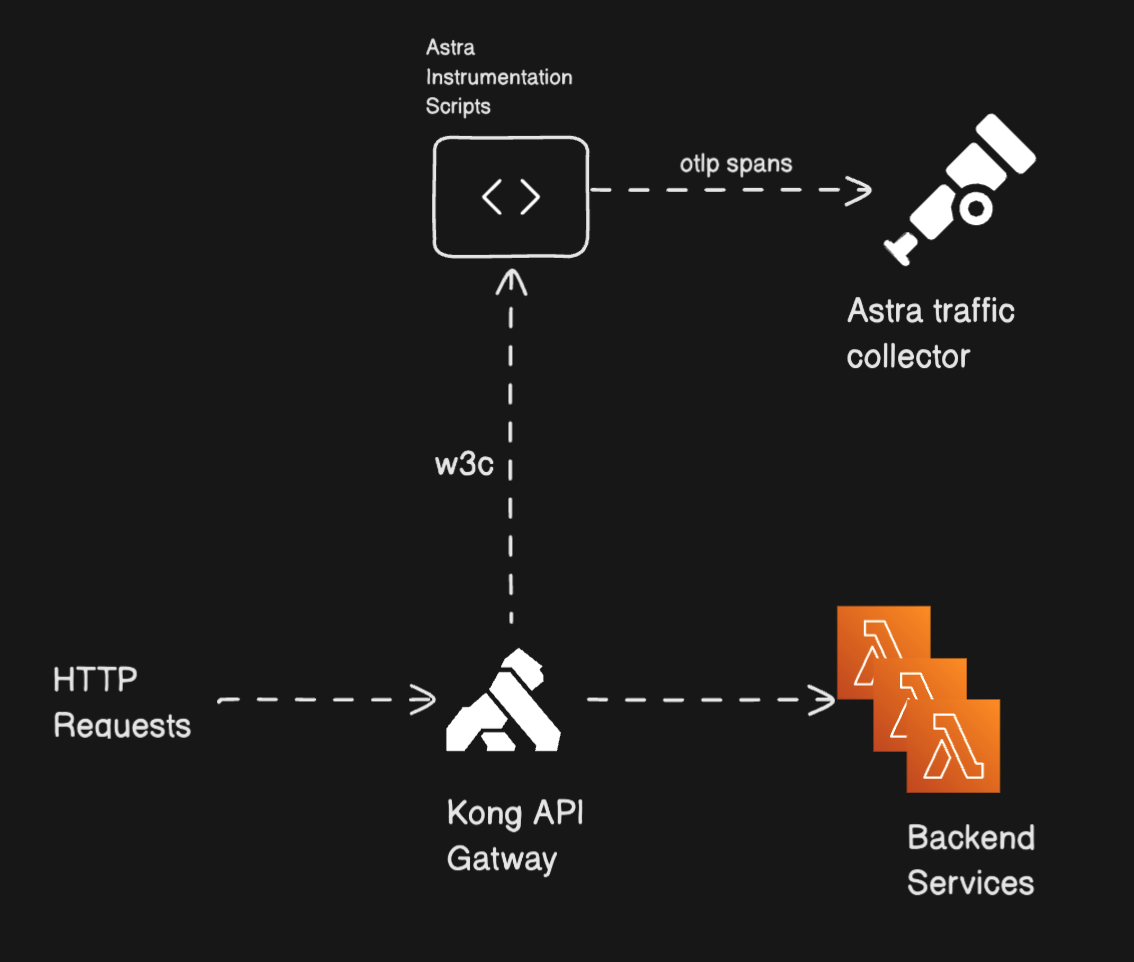
Illustration: High-level integration flow between Kong API gateway and Astra Traffic Collector
Prerequisites
Before setting up, ensure:
Astra Traffic Collector is available and reachable.
Kong instrumentation is created and you have the
sensorIDhandyKong Gateway is installed and running.
You have admin access to Kong configuration (Kong Manager UI or CLI).
At least one service and route exists in Kong.
Kong Manager is accessible (default port:
8002).If Kong Manager is not running on port
8002, you can enable it:# Update your Kong container configuration to expose port 8002 docker run -d --name kong \ -e "KONG_DATABASE=postgres" \ -e "KONG_PG_HOST=kong-database" \ -p 8000:8000 \ -p 8443:8443 \ -p 8001:8001 \ -p 8002:8002 \ # Add this line if missing kong:latest
Quick Installation
Step 1: Set Up OTLP/HTTP Receiver in Astra Traffic Collector
You can configure Astra Traffic Collector to receive OTLP data over HTTP or HTTPS.
📄 How To Set Up OTLP/HTTP Receiver in Astra Traffic Collector
Step 2: Installing and Configuring the OpenTelemetry Plugin in Kong
We will make use of Opentelemetry Plugin provided by Kong to trace the incoming HTTP requests.
Set Required Environment Variable
Inside the Kong container (Or the node where Kong is running):
# First, access your Kong container
docker exec -it kong bash

# Then set the environment variable for HTTP instrumentation
export KONG_TRACING_INSTRUMENTATIONS=http_client
Open Kong Manager
Go to:http://<kong-ip>:8002Add the OpenTelemetry Plugin
Plugins → New Plugin → Search and Chose for "OpenTelemetry".
Choose scope:
Global: Plugin will apply to all services, routes, and consumers - Recommended for system-wide tracing
Scoped: Plugin will apply to specific targets - Select specific Gateway Services - Select specific Routes - Select specific Consumers - Useful for granular control of tracing
Configure OpenTelemetry Plugin
Traces Endpoint:
Enter your OpenTelemetry collector endpoint:
https://astra-traffic-collector-ip-address:4318/v1/traces
Logs Endpoint (optional):
Enter if you want to collect logs
Protocols:
grpc, grpcs, http, https
Propagation Settings
Header Type:
w3c
Resource Attributes:
sensor.version: "1.0.0"service.name: "astra-otel-plugin"sensor.id: "<Replace the sensorID created for your Kong integration in Astra Dashboard>"Example:
sensor.id: "05927cc2-cf2f-4508-a11e-3001964b9113"
Advanced Settings (adjustable):
Batch Span Count: 1
Connect Timeout: 1000 ms
Max Batch Size: 200
Max Entries: 10000
Initial Retry Delay: 0.01
Max Retry Delay: 60
Max Retry Time: 60
Sampling Rate: 0.0–1.0
0.0 for No Tracing
1.0 for 100% Tracing
Read/Send Timeouts: 5000 ms
Review and Save
Click "View Configuration" to review all settings
Verify all parameters are correctly set
Click "Save" to apply the configuration
The plugin will be immediately active based on your scope selection
Verify Configuration
Check the plugin appears in your plugins list
Status should show as "Enabled"
Make a test request through your Kong gateway
Verify sample traces from otel plugin are appearing in
Astra Traffic Collector
Troubleshooting
Verify your collector endpoint is accessible from Kong
Check Kong's error logs for connection issues
Ensure sampling rate is greater than 0
Verify protocols match your service configuration
Step 3: Adding the Kong Functions Plugin for Extended Data Capture
The Kong Functions plugin lets you capture headers and bodies for both requests and responses using lua script
Create Kong Functions Plugin
Return to Kong Manager (
http://<kong-ip>:8002)Go to Plugins → New Plugin → Search and Select
"Kong Functions"Choose the same scope as your OpenTelemetry plugin (Global or Scoped)
Configure Access Phase Function
Find the "Access" field and paste the following code
-- Access phase handler
local root_span = kong.tracing.active_span()
if not root_span then
    kong.log.err("No active span found")
    return
end

-- Get direct client IP (load balancer or actual client)
local peer_addr = kong.client.get_ip()
kong.log.debug("Direct client IP: ", peer_addr)

if peer_addr then
    root_span:set_attribute("net.sock.peer.addr", peer_addr)
end

-- Add http.target
root_span:set_attribute("http.target", kong.request.get_path_with_query())

local function escape_json_value(v)
    if type(v) == "string" then
        return (v:gsub('"', '\\"'))
    end
    return v
end

local headers = kong.request.get_headers()
if headers then
    local headers_str = "{"
    local first = true
    for k, v in pairs(headers) do
        if not first then
            headers_str = headers_str .. ", "
        end

        headers_str = headers_str .. '"' .. k .. '": '

        if type(v) == "table" then
            headers_str = headers_str .. '"' .. escape_json_value(table.concat(v, ",")) .. '"'
        elseif type(v) == "number" then
            headers_str = headers_str .. tostring(v)
        else
            headers_str = headers_str .. '"' .. escape_json_value(tostring(v)) .. '"'
        end

        first = false
    end
    headers_str = headers_str .. "}"
    root_span:set_attribute("http.request.headers", headers_str)
end

-- Add request body in access phase
local ok, body = pcall(kong.request.get_raw_body)
if ok and body then
    root_span:set_attribute("http.request.body", body)
end
Configure Body Filter Function
Find the "Body Filter" field and paste the following code:
-- Constants
local MAX_BODY_SIZE = 1024 * 1024  -- 1MB in bytes

-- Body filter phase handler
local root_span = kong.tracing.active_span()
if not root_span then
    return
end

-- Get chunk and eof flag safely
local chunk, eof
if ngx.arg[1] ~= nil then
    chunk = ngx.arg[1]
end
if ngx.arg[2] ~= nil then
    eof = ngx.arg[2]
end

-- Initialize response_chunks and total size if needed
kong.ctx.shared.response_chunks = kong.ctx.shared.response_chunks or {}
kong.ctx.shared.response_size = kong.ctx.shared.response_size or 0

-- Track size and collect chunks for tracing only
if chunk and type(chunk) == "string" then
    kong.ctx.shared.response_size = kong.ctx.shared.response_size + #chunk
    if kong.ctx.shared.response_size <= MAX_BODY_SIZE then
        table.insert(kong.ctx.shared.response_chunks, chunk)
    end
end

-- Always pass through the original chunk unmodified
ngx.arg[1] = chunk

-- On EOF, set the complete body for tracing
if eof then
    local body = ""
    if kong.ctx.shared.response_size <= MAX_BODY_SIZE then
        body = table.concat(kong.ctx.shared.response_chunks)
    end
    root_span:set_attribute("http.response.body", body)
    kong.ctx.shared.response_chunks = nil
    kong.ctx.shared.response_size = nil
end
Configure Header Filter Function
Find the "Header Filter" field and paste the following code:
-- Header filter phase handler
local root_span = kong.tracing.active_span()
if not root_span then
    return
end

-- Function to escape JSON string values
local function escape_json_value(v)
    if type(v) == "string" then
        return (v:gsub('"', '\\"'))
    end
    return v
end

-- Add response headers in JSON-like string format
local headers = kong.response.get_headers()
if headers then
    local headers_str = "{"
    local first = true
    for k, v in pairs(headers) do
        if not first then
            headers_str = headers_str .. ", "
        end

        headers_str = headers_str .. '"' .. escape_json_value(k) .. '": '

        if type(v) == "table" then
            headers_str = headers_str .. '"' .. escape_json_value(table.concat(v, ",")) .. '"'
        elseif type(v) == "number" then
            headers_str = headers_str .. tostring(v)
        else
            headers_str = headers_str .. '"' .. escape_json_value(tostring(v)) .. '"'
        end

        first = false
    end
    headers_str = headers_str .. "}"
    root_span:set_attribute("http.response.headers", headers_str)
end
Save Configuration
Review all three function configurations
Click "Save" to apply the Kong Functions plugin
Test Your Instrumented Kong API Gateway
Fire some REST API requests to your Kong API Gateway.
Get the success response from API.
You should be able to see the traces in astra-traffic-collector